Profiling apps installed from apt-get
![A flamegraph, where most of the stack is [unknown], only some frames at the bottom are visible: open, file2str](/content/images/size/w960/2024/04/stackframes-unknown.png)
top use the most CPU time. Not very useful with most stack frames [unknown]! From https://share.firefox.dev/3Qg3JJXDo you ever want to profile some Ubuntu/Debian apps installed with apt-get, to see why they're slow, but all your symbols come out as [unknown], or there are stack frames missing? I'll explain how to fix these issues.
As an example, have you ever run top and seen that one of the top users of CPU is... top itself? It seems suboptimal, that the CPU usage debugger, uses so much CPU itself.
I'd like to profile top to find out why it's slow. There's lots of programs like top: prebuilt programs from apt. I've run into many roadblocks trying to profile these prebuilt binaries many times, and I'm not sure anyone's written up a guide yet.
My examples are from Ubuntu 22.04, but will probably work on Debian.
TL;DR
# Install perf
$ sudo apt install --yes linux-tools-common

# Install debug symbols for package you are profiling
$ sudo apt install --yes $FOO-dbgsym

# Allow profiling by non-root users, and visibility to kernel stacks.
$ sudo sh -c 'echo 1 >/proc/sys/kernel/perf_event_paranoid'

# Allow visibility of kernel stack traces
$ sudo sh -c 'echo 0 > /proc/sys/kernel/kptr_restrict'

# Profile an app, using the -dbgsym dwarf information.
$ perf record --call-graph dwarf $(pidof $FOO)

# Convert to a text format
$ perf script --input perf.data -F +pid > perf.txt
Then drag and drop perf.txt into https://profiler.firefox.com.
Install Perf
We'll use perf to profile Linux applications. Install it:
$ sudo apt install --yes linux-tools-common
$ perf version
perf version 5.15.148
Install Debug Symbols for the Profiled App
Debian/Ubuntu packages don't come with debug symbols by default, but we'll need them. They come in debug symbols packages, which conventionally have the same name as the base package, but ending with -dbgsym.
First, we have to find which package top is in, there is no top package. What package installs top? We can see with dpkg --search <path>.
What's the path we should be searching for? I don't know if top is in /bin or somewhere else. which will tell us:
$ which top
/usr/bin/top
Putting it together, we find the package:
$ dkpg --search /usr/bin/top
procps: /usr/bin/top
So top is installed from package procps, therefore the debug symbols will be in procps-dbgsym. Let's install that:
$ sudo apt install --yes procps-dbgsym
The following NEW packages will be installed:
  procps-dbgsym
After this operation, 664 kB of additional disk space will be used.
Setting up procps-dbgsym (2:3.3.17-6ubuntu2.1) ...
Less Paranoid Perf
We could profile as root, but:
- I'm often profiling short-lived apps I need the profiler to run, and I don't trust them to run as
root. - It's a faff having the output files be owned by
root.
If you try profiling on Ubuntu as a non-privileged user, you get this long and incorrect error:
$ perf record -p $(pidof top) --call-graph dwarf
Error:
Access to performance monitoring and observability operations is limited.
Consider adjusting /proc/sys/kernel/perf_event_paranoid setting to open
access to performance monitoring and observability operations for processes
without CAP_PERFMON, CAP_SYS_PTRACE or CAP_SYS_ADMIN Linux capability.
More information can be found at 'Perf events and tool security' document:
https://www.kernel.org/doc/html/latest/admin-guide/perf-security.html
perf_event_paranoid setting is 4:
  -1: Allow use of (almost) all events by all users
      Ignore mlock limit after perf_event_mlock_kb without CAP_IPC_LOCK
>= 0: Disallow raw and ftrace function tracepoint access
>= 1: Disallow CPU event access
>= 2: Disallow kernel profiling
To make the adjusted perf_event_paranoid setting permanent preserve it
in /etc/sysctl.conf (e.g. kernel.perf_event_paranoid = <setting>)
The docs talk about -1, 0, 1, and 2. But the perf_event_paranoid setting is 4 ? Huh? The kernel documentation only describes up to level 2. What is 4? Well, Debian patched in an extra level 3, and Ubuntu changed it to level 4, which means: "disallow all unpriv perf event use". See AskUbuntu, and the commit adding this.
Let's lower (open) this to 1, which is the highest level that allows kernel profiling.
$ sudo sh -c 'echo 1 >/proc/sys/kernel/perf_event_paranoid'I don't really understand the security ramifications here. The LKML thread, where an Android developer tries to upstream it, talks about information leaks and local privilege escalations via perf-events. Maybe reset it once you're done?
Allow Profiling Kernel Symbols
The next hurdle is seeing what functions we are calling in kernel space. You may get this warning:
$ perf record -p $(pidof top) --call-graph dwarf
WARNING: Kernel address maps (/proc/{kallsyms,modules}) are restricted,
check /proc/sys/kernel/kptr_restrict and /proc/sys/kernel/perf_event_paranoid.

Samples in kernel functions may not be resolved if a suitable vmlinux
file is not found in the buildid cache or in the vmlinux path.

Samples in kernel modules won't be resolved at all.

If some relocation was applied (e.g. kexec) symbols may be misresolved
even with a suitable vmlinux or kallsyms file.

Couldn't record kernel reference relocation symbol
Symbol resolution may be skewed if relocation was used (e.g. kexec).
Check /proc/kallsyms permission or run as root.
By default, Linux disallows unprivileged users from seeing the locations of kernel function symbols. Symbol locations are randomised to make attacks on these structures harder.
But I just want to profile, and this is a system that only I'm running code on. Disable this with:
$ sudo sh -c 'echo 0 > /proc/sys/kernel/kptr_restrict'Set it to 1 once you're done if you like.
Profile the Program
Finally! Let's run top in one terminal, then in another, profile it with perf record. Ctrl-C when done:
$ perf record --call-graph dwarf $(pidof top)
^C[ perf record: Woken up 6 times to write data ]
[ perf record: Captured and wrote 1.322 MB perf.data (163 samples) ]
Visualise the Output
My favourite way to look at the output of perf is with Firefox Profiler. Despite being named after the browser, it's a tremendous general-purpose profile analysis UI.
Follow their instructions for loading perf profiles:
$ perf script --input perf.data -F +pid > perf.txt
Then drag and drop perf.txt into https://profiler.firefox.com. All going well, you should see a profile like this:
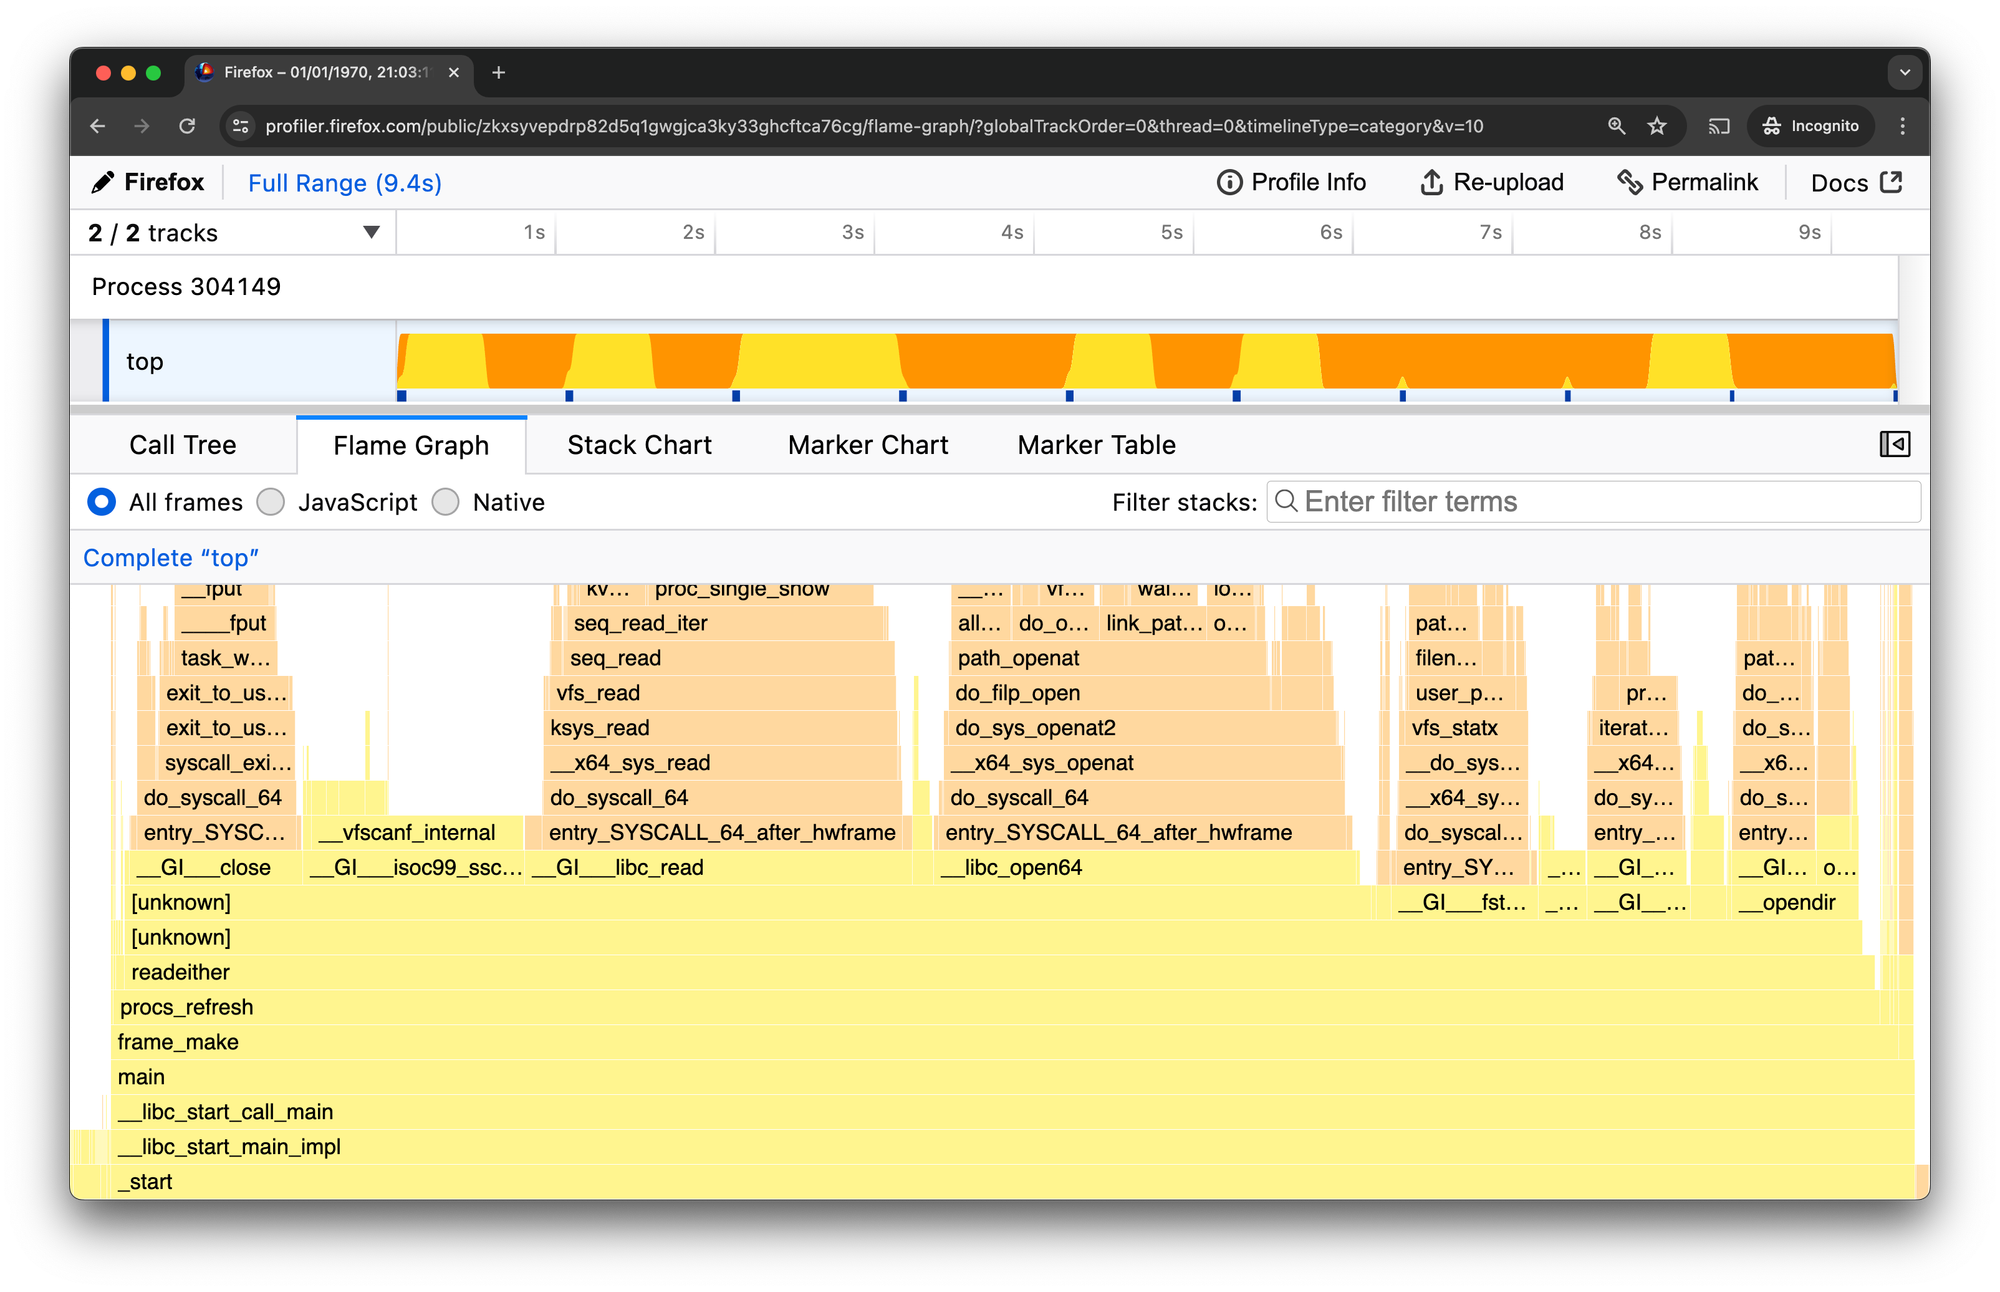
As it turns out, top is using so much CPU because it's spending most of its time inside close, open, fstat, opendir, and getdirents system calls reading thousands of files in /proc.
Resolving [unknown] Stack Frames
I still have some missing [unknown] symbol stack frames. Hovering over the frame, Firefox Profiler tells me these are in file /usr/lib/x86_64-linux-gnu/libprocps.so.8.0.3. Let's install debug symbols for those, too. We can find what package with the same dpkg command:
$ dpkg --search /usr/lib/x86_64-linux-gnu/libprocps.so.8.0.3
dpkg-query: no path found matching pattern /usr/lib/x86_64-linux-gnu/libprocps.so.8.0.3
Huh, I don't know why that doesn't work. Let's try without the path:
$ dpkg --search libprocps.so.8.0.3
libprocps8:amd64: /lib/x86_64-linux-gnu/libprocps.so.8.0.3
OK, weird, dpkg is reporting the file as in /lib, and perf is reporting it's in /usr/lib. Both files exist and have the same hash.
$ sha1sum {/lib,/usr/lib}/x86_64-linux-gnu/libprocps.so.8.0.3
a2a2cd0dc5c0d88282a15e27742bac42a1e550d5  /lib/x86_64-linux-gnu/libprocps.so.8.0.3
a2a2cd0dc5c0d88282a15e27742bac42a1e550d5  /usr/lib/x86_64-linux-gnu/libprocps.so.8.0.3
Maybe it's a bug that dpkg can't find this? If anyone knows, leave a comment?
Anyway, let's guess that libprocps8's debug symbols are in libprocps8-dbgsym:
$ sudo apt install --yes libprocps8-dbgsym
Setting up libprocps8-dbgsym:amd64 (2:3.3.17-6ubuntu2.1) ...
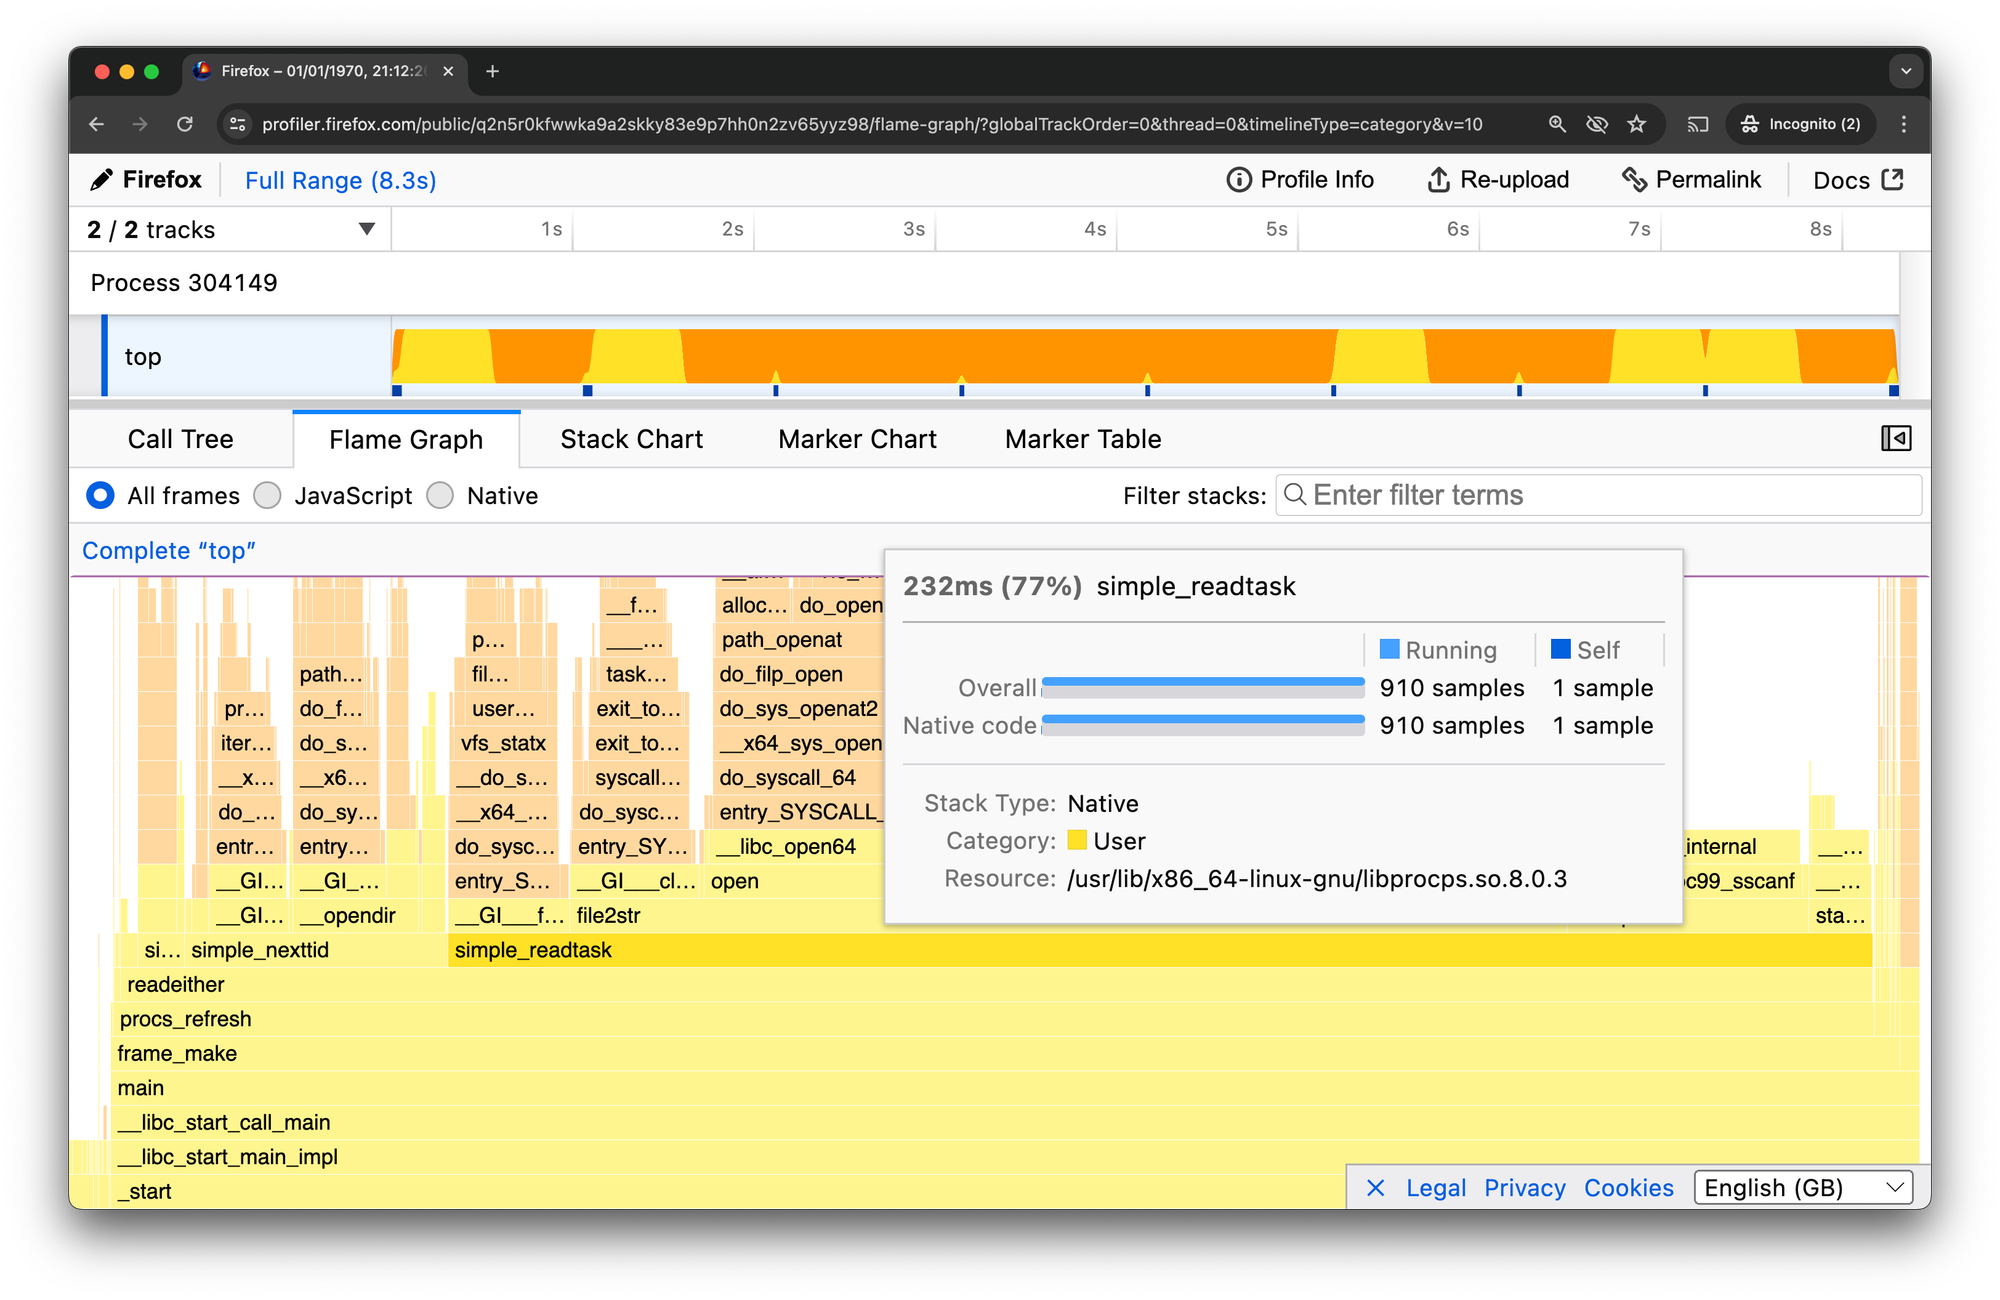
Excellent. Re-profiling, the profile looks complete. We can see the previously-unknown symbols in the libprocps.so.8.0.3 frames. Here, simple_readtask:
Common Problems: No Kernel Stack Frames
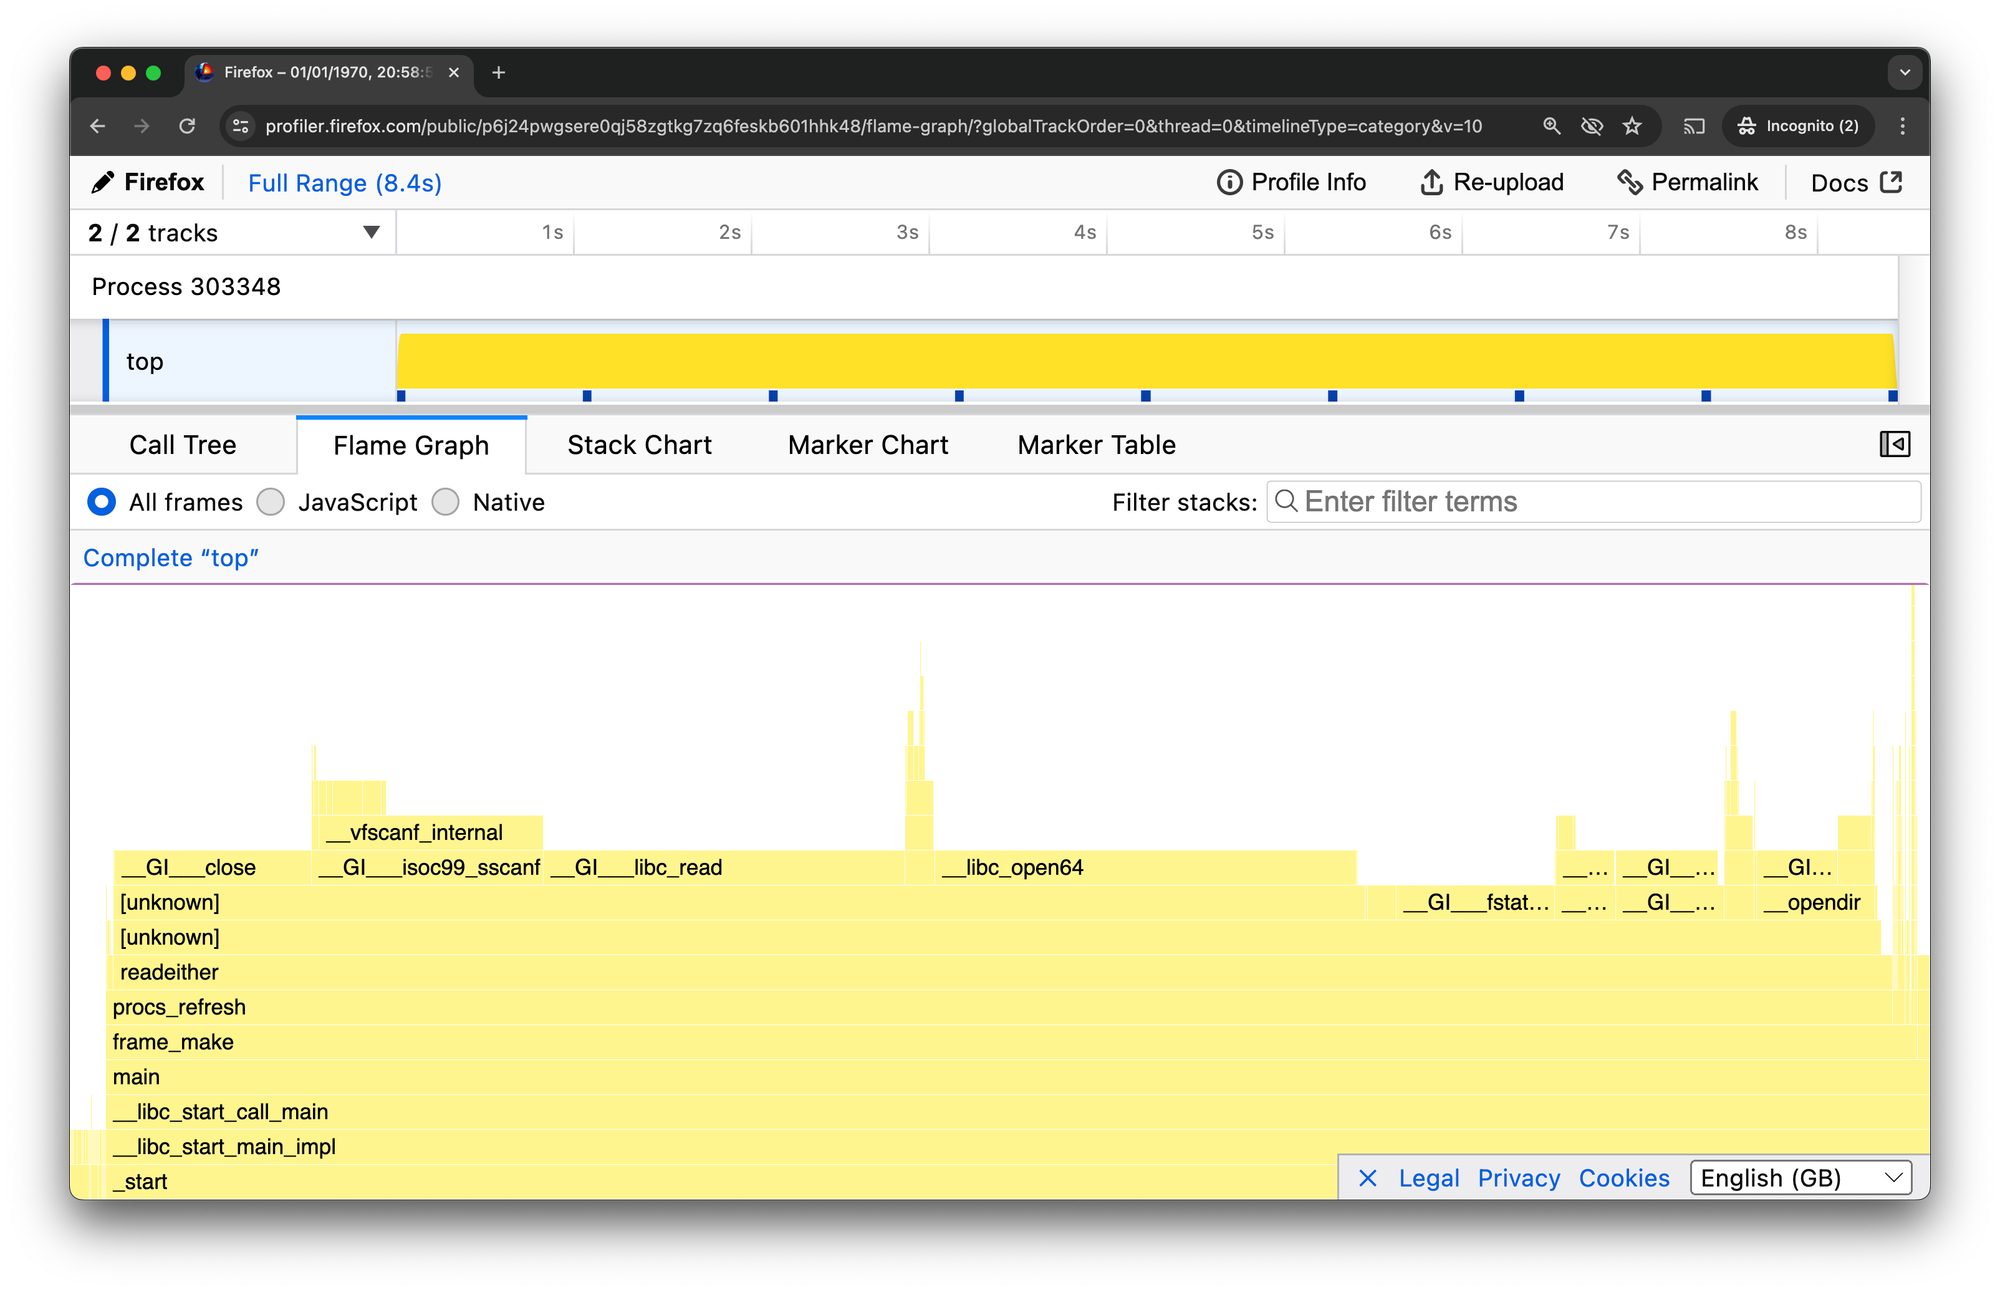
If your profile is only yellow (userland) frames with no orange (kernel) frames, you may be missing permission to profile the kernel. Check the "Less Paranoid Perf" section above.
Common Problems: No Kernel Stack Symbols
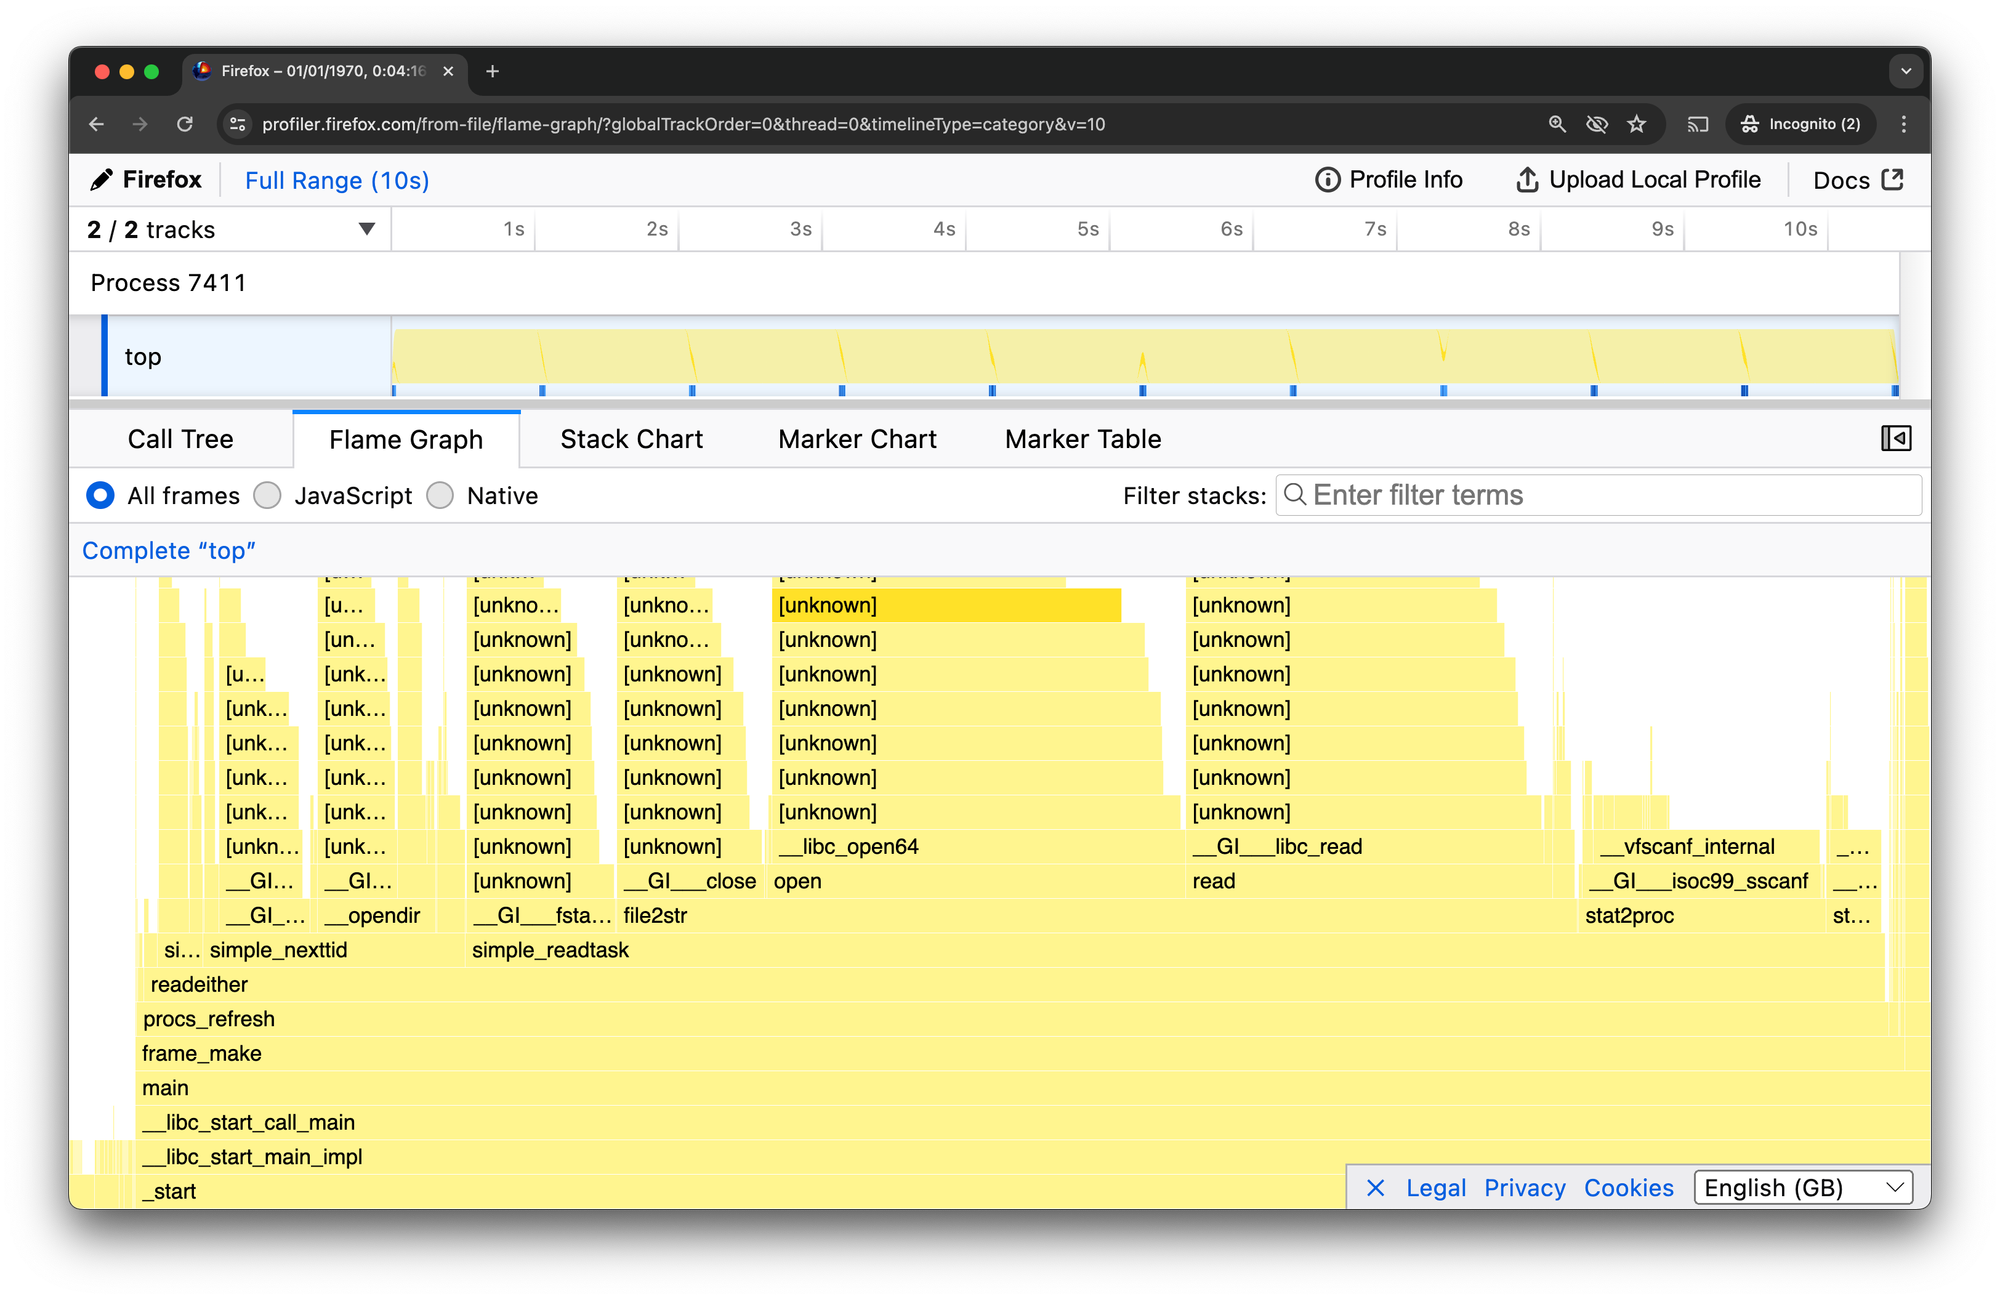
If you have kernel stack frames, but they all say [unknown], check the "Allow Profiling Kernel Symbols" section above.
Conclusion
Well, this is a bit of a faff! Can't we have nice things? No wonder hardly anybody bothers to profile, and so much of our software is still so slow.
Maybe one day, perf can be security-hardened enough that these settings could be enabled by default?
Until then, I hope this checklist can help lower the bar to understanding software performance. Go, profile, and make code faster!



Comments ()