Profilerpedia: A map of the Software Profiling Ecosystem
Summary: I mapped out over 100 Profilers, what Profile Data Formats they output, and what Profiler UIs can visualise those formats: Profilerpedia.
I want to make software faster, so I do a lot of profiling. But often, I get stuck using only the profile analysis UIs built for a specific platform.
Profile Analysis UIs and Visualisers help people analyse profiles. Profile data files are usually large – many megabytes – too much information to read directly by humans. Visualisation and summarisation are necessary to understanding profile data.
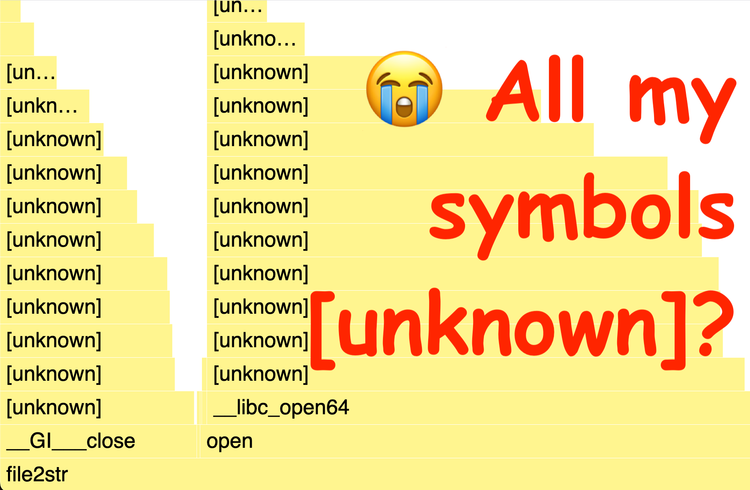
I often want powerful visualisation features: symbolisation, deobfuscation, aggregated flamegraphs, time-series flamecharts, duration filtering, per-thread and per-process tracks, thread/process drilldown, fast search, stack pivoting, permalink-sharing, profile diffing, joining multiple profiles.
But these features are expensive to implement, and profilers are very siloed: different programming languages, runtimes, and OS's often have different profilers and analysis UIs. Most profilers have few analysis features.
Converting my platform-specific profile data to another profile format often unlocks much better profile visualisers – for example:
- Converting Linux perf's
perf.datafiles to Brendan Gregg's Folded Stacks format allows creating SVG Flamegraphs. - Converting Android Simpleperf's
perf.datafiles to Gecko Profile Format allows analysing Android app performance using the phenomenal Firefox Profiler.
This happened to me enough times that I think it's worth mapping out what profile analysis UIs can read different profiler data formats, and how to convert between profile data formats. I suspect many engineers are suffering with poor analysis UIs, unaware that better tools are available.
Software profiling is a rich ecosystem, with hundreds of distinct profilers, profile data formats, and profile visualisers.
I hope this profiler ecosystem map will be useful for:
- Performance engineers who are looking for better or complementary profile analysis tools. e.g. convert your language-specific profile to Firefox Profiler format to get link-sharing.
- Profiler Engineers, who are looking to leverage pre-existing profile formats and analysis UIs. e.g. if you're writing a profiler for a new language runtime, output Folded Stacks format to leverage the FlameGraph toolkit, or Gecko Profile format to leverage Firefox Profiler.
- Analysis UI Engineers, who are looking to accept different profile formats, or find pre-written parsers for those formats.
- Profiler Product Managers, trying to bring new profilers to market.
- Profiler Standardisers, who are looking to standardise on profiling formats. For example, OpenTelemetry is discussing profile formats. I anticipate a wave of evolution, then consolidation and standardisation as the cloud profiler space rapidly heats up and then matures.
I did a quick look through Google Scholar and couldn't find a comparable literature review, so I think Profilepedia is the most complete map of the profiling ecosystem available on the web.
Structure
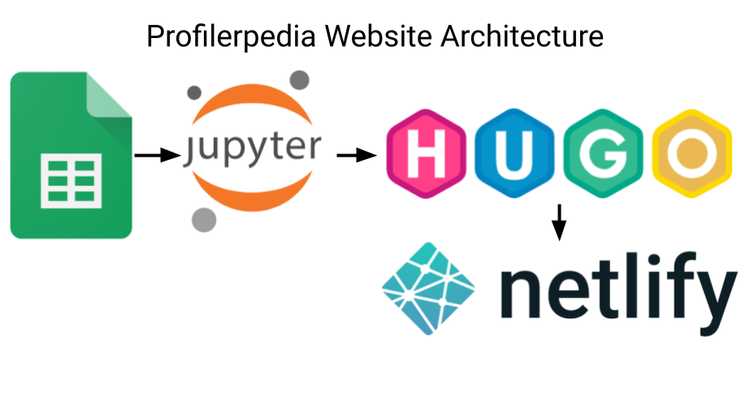
Profilerpedia is 6 tables, laid out like a normalised relational database:
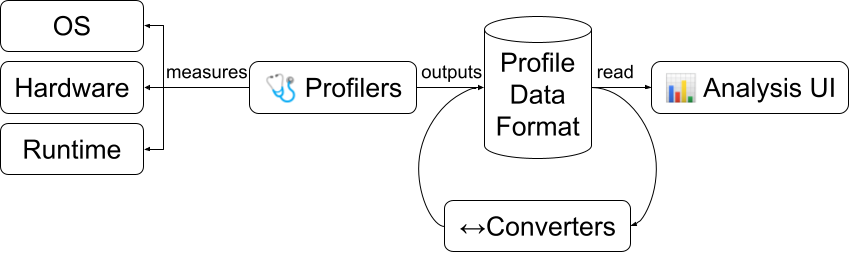
- Profilers: Profilers measure a system.
- Formats: File formats output by Profilers and read in by UIs.
- UIs: Analysis UIs for interpreting profiles
- Outputs: which profilers output which formats. many:many Profiler:Format relationship.
- Converters: which converters can change one format into another
- Visualises: which UIs can read which Formats. many:many Format:UI relationship.
Terms
Profilers measure the performance of software and hardware, and help you narrow down the cause of performance problems, so you can optimise your system performance. Profilers generally run alongside some workload that's being measured.
Profilers most commonly measure time (latency), but can also measure memory allocation, memory usage, bandwidth usage, cache performance, disk performance, and many other resources.
Profilers can measure many targets:
- OS-specific profilers: Linux perf, Android Profiler, and Windows Performance Recorder. Integration with the OS kernel is often critical for measuring I/O performance.
- Runtime-specific profilers, e.g. JDK Flight Recorder measures Java, py-spy measures Python, and the V8 Profiler measures JavaScript. Integration with the runtime is critical for interpreted or JIT-compiled languages.
- Hardware-specific profilers: e.g. Qualcomm's Snapdragon Profiler for the Qualcomm Snapdragon SoC and Intel's VTune Profiler for Intel CPUs.
Profilers typically output profiles, usually as files in some profile data format. For example, Go's CPU Profiler outputs profiles in pprof format, and Windows Performance Recorder outputs profiles in "Event Tracing for Windows" format.
There is a blurry line between Profilers and Tracers with much overlap. Usually, Profilers sample data at some frequency (e.g. sampling stacks on-CPU at 1000Hz). Tracers are usually code that's been instrumented to log when it hits a certain codepath. Many analysis toolkits combine sampling and instrumentation, so I've included both tracers and profilers in this analysis.
Many Profilers have both the measurement and analysis built-in: for example Chrome DevTools can profile code and analyse the profile. I've modelled these as both Profilers and UIs.
Next Steps
I'm definitely missing some entries. Please suggest additions/changes by leaving comments on the spreadsheet backing the website.
I hope to use this map to:
- Write a blogpost about the strongly-connected nodes in the graph: the "lingua franca"/Rosetta-stone profilers, formats, and UIs.
- Plot the dataflow in Graphviz, to identify popular, but disconnected data formats, or excellent but disconnected analysis UIs, and see if we can build converters to connect them.
- Build converters between popular profilers and analysis UIs to unlock better analysis.
- Update profiler documentation to point to great analysis UIs that can accept the output for that profiler.
Fingers-crossed, with relatively-small effort (building converters, documenting existing converters and analysis UIs) we can empower engineers profiling many different languages/runtimes, with far more powerful profiling tools.
Long-term (very speculative), this M*N mesh of profiling data formats might benefit from a conversion toolkit that turns M*N converters into M+N readers and writers.


Comments ()